· Menu & Food · 12 min read
How to Control Food Costs in a Restaurant: Daily Systems
How to control food costs in a restaurant: track theoretical vs. actual food cost weekly, tighten purchasing and receiving, cut waste, stop portion drift.
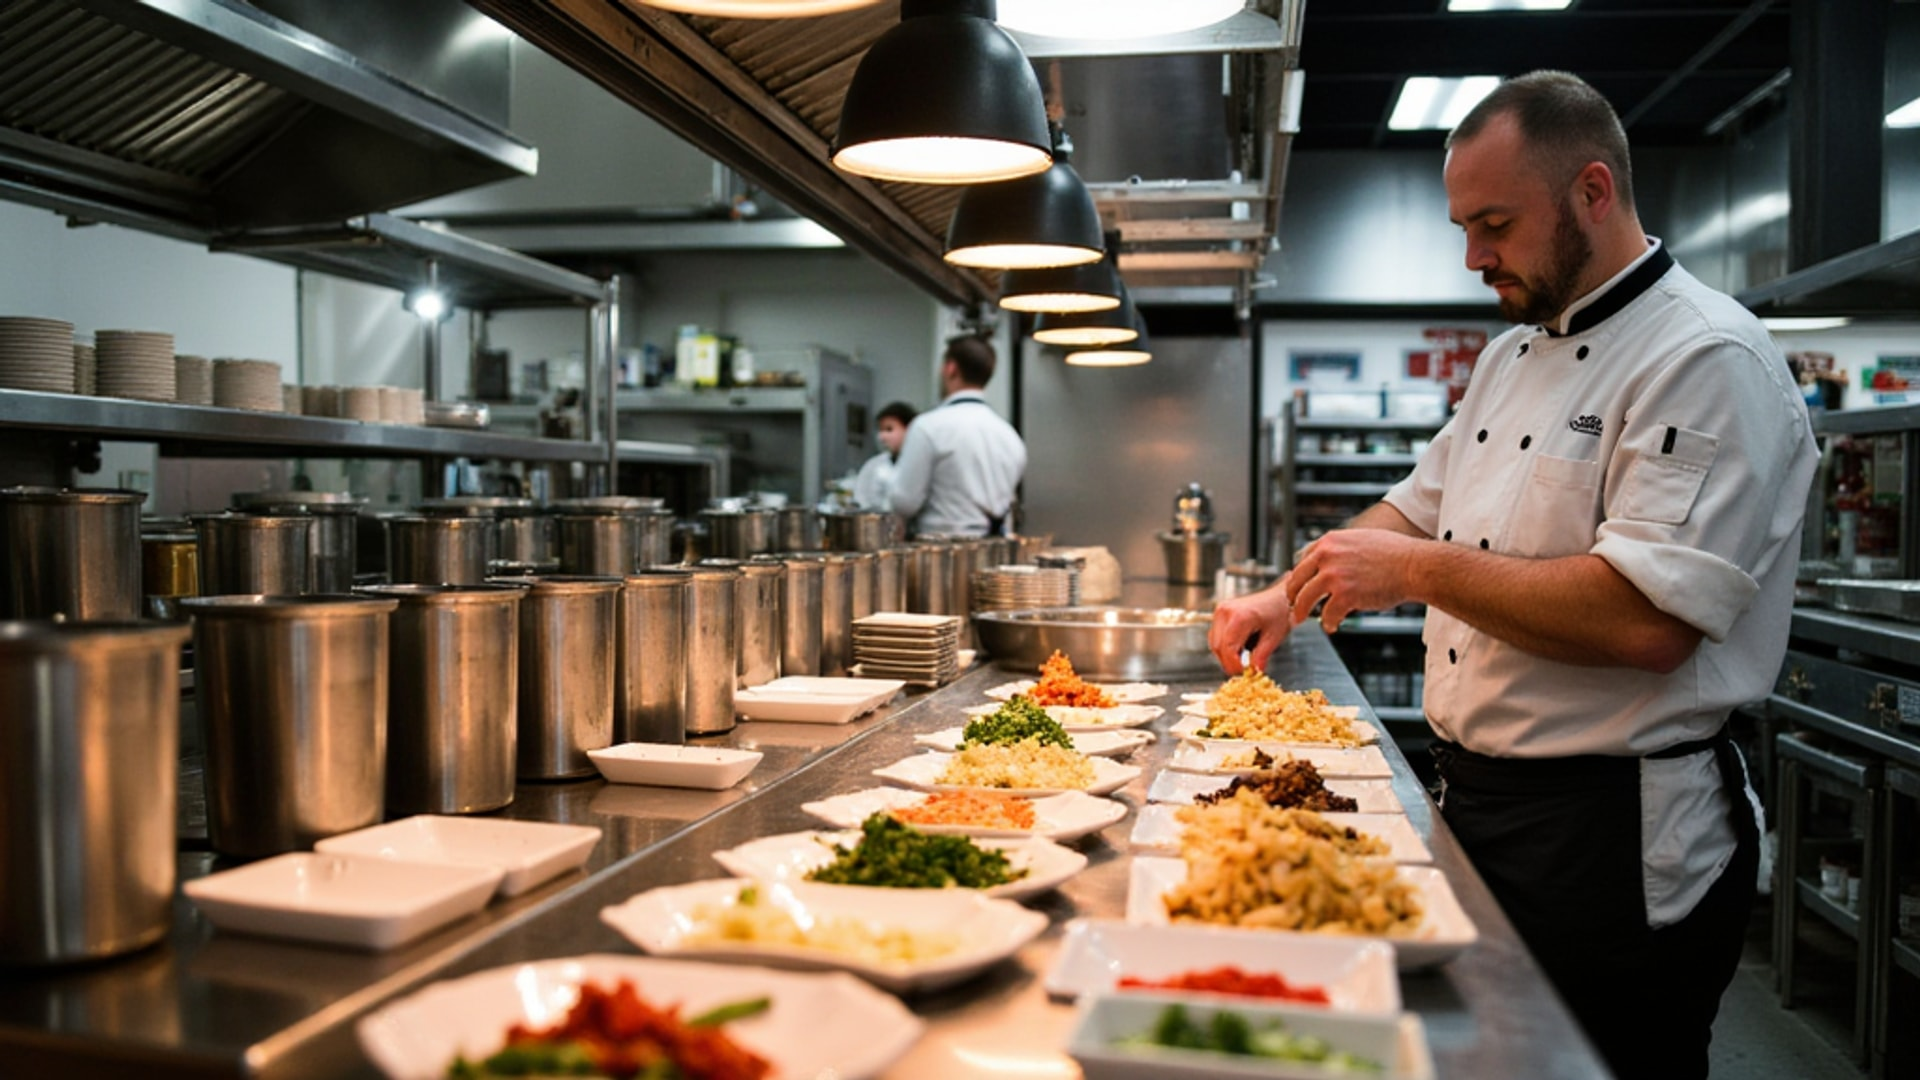
To control food costs, compare your theoretical food cost (what your recipes say you should have spent on what you sold) with your actual food cost (what inventory says you spent) every week. Then close the gap at the points where money leaks: purchasing, receiving, storage, prep and portioning, service, and cash control. A gap of 1 to 2 points is normal. Three or more means something specific is broken.
Most operators try to fix food cost with one move, usually a new supplier or a price increase. It rarely holds, because food cost is the sum of hundreds of small decisions made every day by the people who order, receive, store, prep, cook, plate, and ring in your food. The fix is a system, and the system starts with measurement.
The stakes are easy to calculate. A restaurant doing $2 million a year that brings food cost from 34% down to 31% keeps another $60,000, without serving a single extra guest. With full-service net margins in the low single digits, that can be the difference between a good year and a bad one.
What Causes High Food Costs?
High food costs come from two places: paying too much for ingredients, or losing ingredients between the delivery door and the guest’s plate. The second is usually bigger. Over-portioning, waste, spoilage, theft, and unrecorded comps all raise actual food cost without touching the recipe card, which is why the theoretical-versus-actual gap is the first number to check.
| Leak | What it looks like | First fix |
|---|---|---|
| Over-portioning | Plates leave heavier than the spec | Scales at every protein station; line checks |
| Prep waste | Trim loss above the recipe’s expected yield | Yield tests; knife-skills training |
| Spoilage | Product thrown out past date or poorly rotated | FIFO with date labels; order to par |
| Receiving errors | Short weights, wrong items, price above quote | Check every delivery against the purchase order |
| Theft | Shrinkage with no explanation | Locked storage for high-value items; issue logs |
| Unrecorded comps and staff meals | Food leaves without a sale attached | Every comp and staff meal rung into the POS |
| Recipe drift | Cooks making dishes their own way | Standardized recipe cards with photos |
| Stale pricing | Menu prices set on old ingredient costs | Re-cost recipes monthly and on big price changes |
Theoretical vs. Actual Food Cost: How to Measure the Gap
Theoretical food cost is what food should have cost given your sales mix and recipe costs. Calculate it by multiplying each item’s plate cost by the number sold (from your POS product mix report), adding those up, and dividing by food sales. Actual food cost comes from inventory:
- Cost of goods sold = Beginning inventory + Purchases − Ending inventory
- Actual food cost % = Cost of goods sold ÷ Food sales × 100
- Variance = Actual food cost % − Theoretical food cost %
Say theoretical comes in at 29% and actual at 35%. That 6-point gap on $100,000 of monthly food sales is $6,000 a month leaving the building without a sale attached to it.
| Variance | What it usually means | What to do |
|---|---|---|
| Under 1 point | Normal counting noise and minor waste | Keep tracking |
| 1–2 points | Typical for most kitchens | Watch the trend week to week |
| 2–3 points | Something is slipping | Check your highest-cost items one by one |
| 3 points or more | A systemic problem | Investigate portioning, waste, receiving, and theft now |
Lightspeed’s food cost guide treats a gap of more than 2 to 3 points as the signal to act. One bad week is a prompt to look. Three bad weeks in a row is a pattern, and it needs a root-cause investigation, not a pep talk.
How Do You Find Where the Food Cost Variance Comes From?
Work from the cheapest explanation to the most expensive one. Recount before you accuse anyone: a missed case in the walk-in or a unit mix-up (each vs. case) can create a gap on its own. Then follow the money in this order:
- Check the count. Same counter, same units, same time of day as last period.
- Check invoices against recipe cards. If salmon went up $2 a pound and the card still uses the old price, the “variance” is stale costing.
- Run item-level variance on proteins and alcohol. Compare usage in pounds to what the product mix says you should have used.
- Pull comp, void, and discount reports. Food that left with no sale attached shows up here.
- Read the waste log. Spoilage and overproduction show up as patterns by day and item.
- Compare shifts and dayparts. A variance concentrated on one shift points to a person or a process on that shift.
Track Food Costs Daily, Then Weekly
Monthly food cost belongs in your accounting. It is too slow for control. The Typsy hospitality blog recommends using daily purchases against daily revenue as an early-warning system. It is rough on any single day and gets more accurate as the month goes on, but a spike shows up within a day instead of four weeks later.
The weekly routine that 7shifts recommends is simple:
- Enter supplier invoices daily, split into food and beverage categories.
- Record sales and hourly payroll daily.
- Take a physical inventory at the end of each week, with the same counting method every time.
- Complete and review the prime cost report the next day, while the week is still fresh.
Operators who review prime cost weekly routinely improve their bottom line by 2% to 5% compared with monthly or quarterly reviewers, in 7shifts’ experience. The point is not the report. The point is that a cook who over-portioned on Tuesday hears about it on Monday, not six weeks later.
Purchasing: Buy What You Will Actually Use
Over-ordering is a cash problem before it becomes a waste problem. Product sitting in the walk-in has been paid for, and if it spoils before it sells, you paid for it twice.
- Order to par. Set par levels from actual usage plus a buffer, not from habit. Review them when the menu or the season changes.
- Forecast from your POS. NetSuite’s guidance is to use historical sales by day of week, adjusted for weather, holidays, and local events, to set order and prep quantities. A restaurant near a stadium or a convention center that ignores the event calendar will either run out or throw food away.
- Use technology where volume justifies it. Peppr POS benchmark data puts the reduction in over-purchasing from predictive ordering at 20% to 30% for operations that implement it.
- Meet suppliers formally three times a year. Typsy’s advice, and a good one: suppliers know where prices are heading and which specifications you can change without guests noticing. A lower-grade cut for a dish braised for four hours is a classic example; the grade difference disappears in the pot.
- Pool your buying power. A group purchasing organization such as Foodbuy gives an independent restaurant contract pricing it could never negotiate alone.
Ingredient price is the only lever that lowers both theoretical and actual food cost at the same time, because it changes the cost at the source. Everything else in this guide closes the gap between them.

Receiving: Check Every Delivery
Every delivery should be checked against the purchase order before the driver leaves: counts, weights, product specs, temperatures, and the price on the invoice against the price you were quoted. A short case or a price that crept up 40 cents a pound becomes food cost the moment someone signs for it.
Make it a written procedure with one trained person responsible per shift. Weigh proteins. Open a few cases of produce. Reject product that arrives warm or damaged, and get a credit memo on the spot rather than a promise. Our guide to vendor delivery receiving has a full checklist.
Storage and Inventory: FIFO, Labels, and Counts
First-in, first-out rotation keeps older product moving before newer deliveries. It only works when every container has a label with the item and the date; an unlabeled tub cannot be rotated, it can only be guessed at. Temperature control protects perishables, and an organized walk-in makes counting faster and more accurate.
Count on a fixed schedule:
- Full inventory weekly, using the same units and the same shelf-to-sheet order every time.
- Spot counts daily or every few days on the expensive items: proteins, seafood, alcohol, specialty ingredients.
- Issue logs in larger kitchens, so product moving from storage to the line is recorded.
The more often you count high-cost items, the smaller the variance you can detect and the faster you can act on it.
Prep and Portioning: Where Most of the Variance Comes From
Over-portioning is the most common single source of the gap between theoretical and actual food cost in most kitchens, according to Restaurant365. It is also the easiest to underestimate.
Run the math on one protein. A 10-ounce portion that consistently goes out at 11 ounces is a 10% over-cost on that item. At 50 covers a night for 300 nights, that is 15,000 extra ounces, about 940 pounds, served for free every year. At $12 a pound, roughly $11,000 on one menu item.
The controls are simple and mostly cheap:
- Scales at every protein station, used on every portion, not just during training.
- Standard scoops, ladles, and spoons for sides, sauces, and anything portioned by volume.
- Recipe cards by weight, not volume, for anything where precision matters.
- A plating photo at each station showing the correct portion.
- Line checks before service, where the opening chef confirms portions, prep, and mise en place against the spec.
Training changes compliance more than tools do. Cooks who understand that an extra ounce of salmon on every plate costs the restaurant thousands a year portion differently from cooks who were simply told to use the scale. Show them the math.
Trim yield is part of portioning. Poor butchery leaves money on the cutting board, and proper breakdown technique of the kind taught at the Culinary Institute of America directly lowers trim loss. Run a yield test whenever you change a supplier or a cut, and update the recipe card with the result.

Waste: Measure It Before You Try to Cut It
Industry data compiled by Lightspeed shows 4% to 10% of purchased food becomes pre-consumer waste, thrown away before it ever reaches a guest. You cannot cut what you do not measure, so start with a waste log: what was discarded, how much, and why (spoilage, overproduction, trim, cooking error, returned plate).
Within a few weeks the log shows patterns. Tuesday overproduction of soup is a prep-sheet problem. Wilted herbs every Friday is an ordering or storage problem. Lots of trim on one product is a yield or supplier problem. Each has a different fix, and the log tells you which.
The return is real: the National Restaurant Association puts it at about $8 in savings for every $1 invested in waste reduction. Start with the two or three biggest sources rather than overhauling everything at once; our guide to food waste reduction covers the methods in detail.
Theft, Comps, and Cash Control
The National Restaurant Association has long reported that employee theft accounts for 75% of inventory shortages. Most of it is not dramatic. It is a case of steaks walking out the back door, drinks poured for friends, and meals that never get rung in.
Controls that work without poisoning the culture:
- Lock storage for proteins, seafood, and alcohol, with keys held by managers.
- Ring every comp, staff meal, and void into the POS with a reason code and manager approval.
- Review void and discount reports weekly, by employee.
- Keep receiving and inventory counts separate from the person who orders.
Unrecorded sales hurt twice: the food is gone and the revenue never appears, so the food cost percentage rises on both sides of the fraction. More controls are in our loss prevention guide.
Use the Sales Mix
Food cost percentage is an average weighted by what you sell. If guests shift toward your expensive proteins, the blended number rises even when every dish is made exactly to spec. No amount of portion control fixes that. It is a menu and sales problem.
Menu engineering sorts dishes by popularity and contribution margin so you can promote the profitable ones through placement, descriptions, and server recommendations. Server upselling works best when it pairs high-cost mains with low-cost, high-margin add-ons. Beverages are the strongest mix lever you have, with pour costs typically around 18% to 24% against food costs of 28% to 35%.
What to Do When Ingredient Prices Rise
When a key ingredient jumps, you have three options: absorb it, raise the price of the dishes that use it, or change the recipe. Absorbing works for a small or temporary increase when your overall food cost has room. A sustained increase on a major ingredient needs a price change or a recipe change.
Recipe changes are often the better answer, if guests won’t notice. Swap a vegetable for one that is in season. Use a less expensive cut with a better technique. Reduce a side portion by 10%, which rarely registers, while leaving the main protein alone, which always does. Typsy’s guidance is to look for adjustments that improve the numbers “without noticeably reducing the customer’s perception of value”, and presentation helps: a slightly smaller protein sliced and fanned across the plate can look more generous than a larger piece dropped in the middle.
Avoid the slow spiral of cutting quality every time costs rise. Regulars notice the third cut even if they missed the first two.
A Food Cost Control Routine
| When | What to do |
|---|---|
| Every delivery | Check against the purchase order; weigh proteins; verify prices |
| Daily | Enter invoices; compare purchases to sales; fill in the waste log; line check before service |
| Weekly | Full inventory count; actual vs. theoretical food cost; prime cost report; void and comp review |
| Monthly | Update recipe costs from invoices; review par levels; look at variance by item |
| Quarterly | Menu engineering review; yield tests on key proteins and seasonal produce; supplier meeting |
| Annually | Competitive bids on major categories; review GPO membership; reset food cost targets |

None of this needs expensive software to start. A clipboard waste log, a scale at every station, and a weekly count compared against your recipe cards will find most of the money. The operators who hit their food cost targets every month are not the ones with the best suppliers. They are the ones who look at the number every week and ask why it moved.