· Case Studies · 11 min read
Menu Engineering With Data Analytics: How Restaurants Use Numbers to Redesign Menus
TGI Fridays drove a 5% same-store sales increase through data-driven menu redesign without changing a single price — and advanced optimization methods consistently deliver 15%+ profitability improvements by targeting the items customers actually buy.

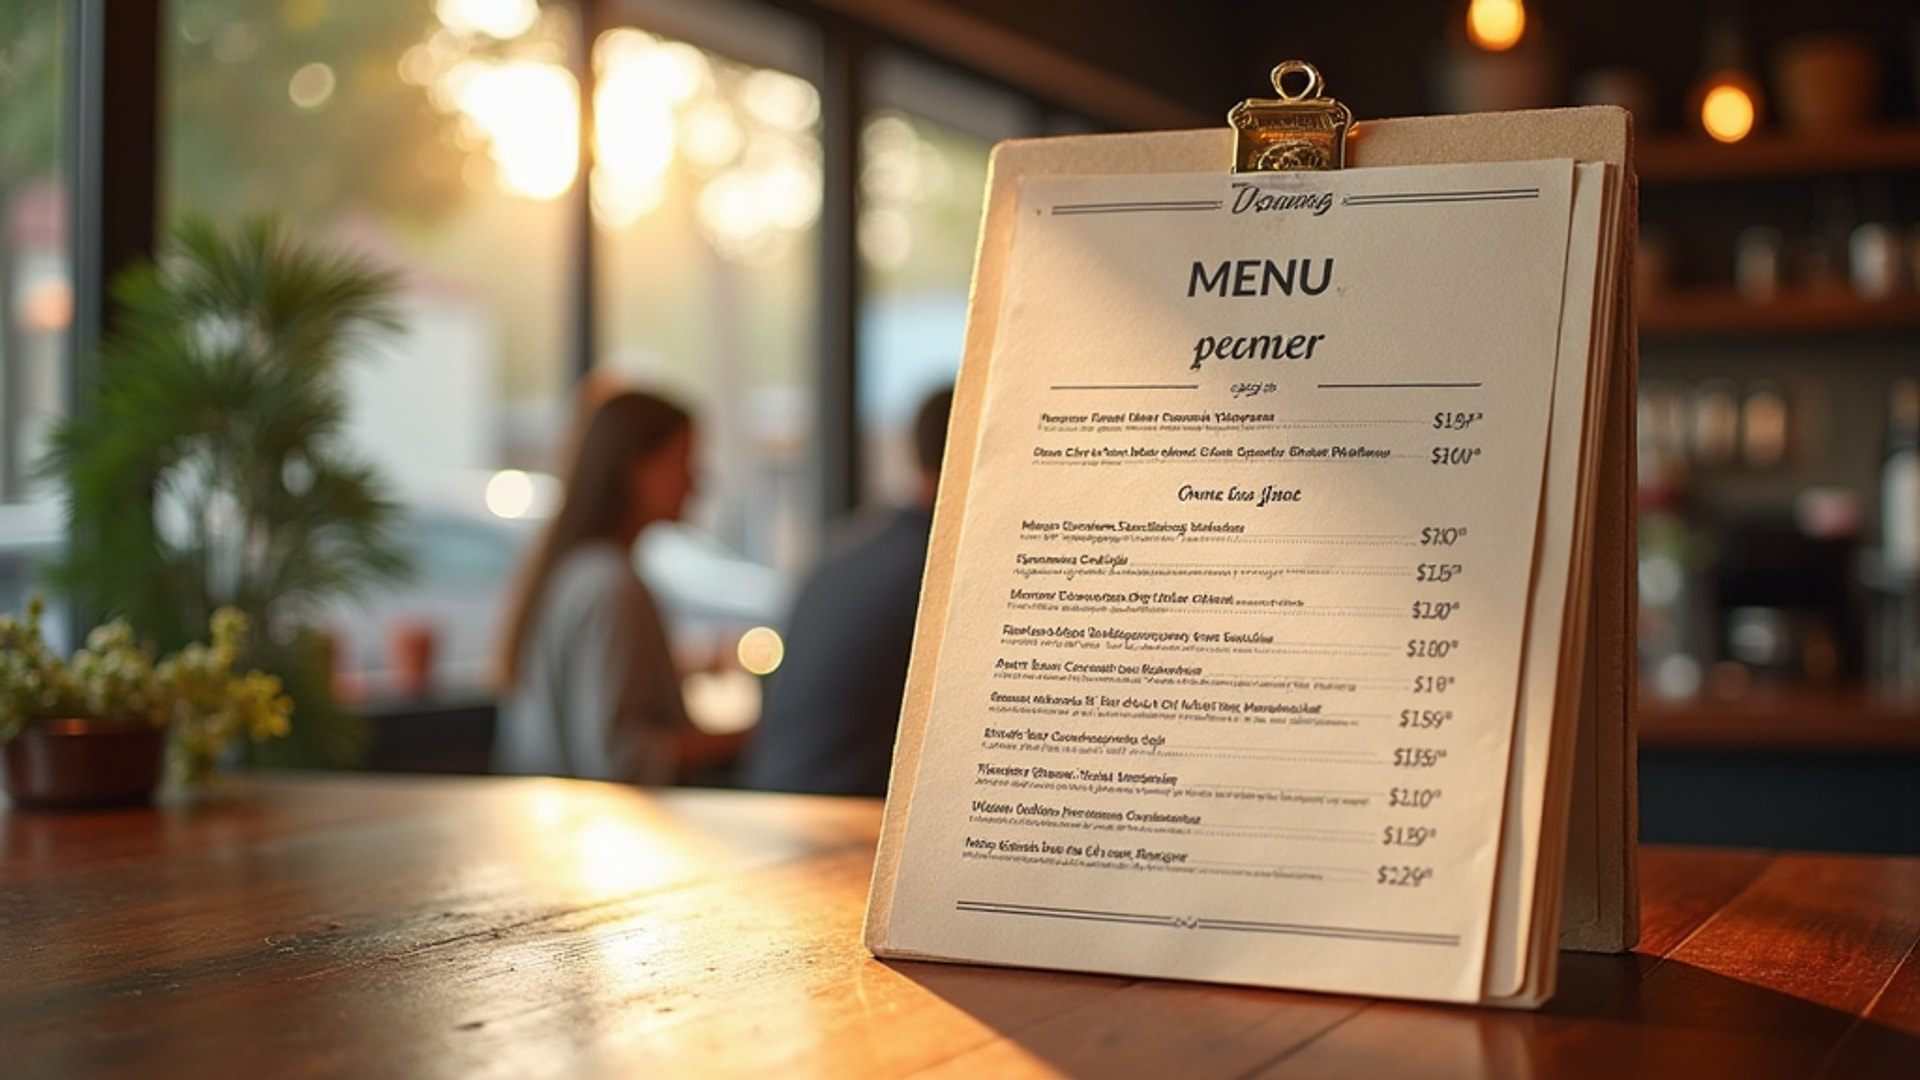
Every restaurant menu is a financial document masquerading as a food list. The items on it, their sequence, their descriptions, their prices, and the visual emphasis they receive are all decisions that directly affect how much money the restaurant makes from each customer who sits down with that menu. Most restaurants make those decisions based on intuition. The ones making them based on data are systematically outperforming those that don’t.
Menu engineering is the discipline that connects analytical rigor to menu design. It has existed in formal frameworks since the 1980s, when researchers began documenting the relationship between item profitability, item popularity, and menu presentation. What has changed in the last decade is the quality and availability of data that makes the analysis possible — and the sophistication of the methods operators are using to act on it.
The Four-Quadrant Framework
The foundational tool of menu engineering categorizes every menu item into one of four quadrants based on two dimensions: contribution margin (profit per item sold) and sales volume (how often the item is ordered).
According to Supy’s analysis of menu optimization methods, the resulting categories are:
Stars — High contribution margin, high popularity. These items generate both volume and margin. They are the menu’s most valuable assets and should be prominently featured, protected from price sensitivity analysis that might suggest removing them, and used as anchor items in the menu’s visual hierarchy.
Plowhorses — High popularity, low contribution margin. These items sell in high volumes but generate thin per-unit profit. They may be dragging down average check profitability even while they contribute to customer satisfaction. Management options include cost reduction (recipe adjustment, portion review, supplier negotiation), portion reduction at consistent price, modest price increases if the item has price inelastic demand, or using them as loss leaders to drive higher-margin accompanying purchases.
Puzzles — High contribution margin, low popularity. These items would significantly improve profitability if sold more frequently, but customers aren’t ordering them. The question for Puzzles is why: Is the description unclear? Is the item positioned poorly on the menu? Is the price creating a barrier? Is the visual presentation insufficient? Puzzles are opportunities, not failures — they just need better marketing within the menu itself.
Dogs — Low contribution margin, low popularity. These items consume menu real estate, kitchen capacity, and inventory management resources while generating minimal revenue or profit. The default recommendation is removal, though operators should verify that Dogs aren’t serving a specific customer segment need before deleting them. Sometimes a Dog exists because it anchors a dietary restriction (the only gluten-free option, the only vegetarian protein) rather than because customers want it for its own sake.
TGI Fridays: A Documented Case
The most frequently cited documented application of menu engineering with measurable results comes from TGI Fridays. According to Supy’s analysis, the company’s menu redesign using psychology and engineering principles drove a 2.5% same-store sales increase in the first year, growing to over 5% by the second year.
In the competitive casual dining segment, where same-store sales growth of any amount is considered a meaningful achievement, these numbers represent genuine strategic success. The relevant detail is what produced them: not price increases, not new menu items, not promotional spending — but the redesign of how existing items were presented and positioned on the menu.
The redesign incorporated menu psychology principles: using visual design elements to draw attention to high-margin items, optimizing item placement within the visual hierarchy that customers naturally follow when reading a menu, improving item descriptions to increase perceived value, and removing menu clutter that diffused customer attention.
The implication is significant. TGI Fridays did not need to raise prices or change its food to improve profitability by 5%. It needed to get better at directing customer attention toward the items that were already the most profitable.

Real-Time Analytics vs. Periodic Review
Traditional menu engineering was a periodic exercise — conducted quarterly or annually by pulling sales data, running the analysis, and making adjustments. Modern restaurant analytics platforms have changed this significantly.
Point-of-sale systems now generate item-level sales data in real time.
→ Read more: Menu Engineering Worksheet: Using the Profitability Matrix in Practice Restaurants that have invested in analytics infrastructure can track individual item performance daily, identifying trends as they emerge rather than reviewing them after they’ve compounded for months.
According to Supy’s analysis, this real-time capability enables continuous menu optimization rather than periodic reviews. A restaurant that notices a Puzzle item gaining traction can test promotional positioning immediately. A restaurant that detects a Star item declining in sales can investigate causes before the decline becomes a structural problem. A restaurant that identifies a Dog consuming significant kitchen labor for minimal returns can remove it from the menu faster.
The time value of this data is substantial. Menu problems identified and addressed in week three are significantly less costly than the same problems identified and addressed in month four. The delay between data collection and decision-making is itself a source of value destruction that real-time analytics eliminates.
Time-of-Day Analysis
One of the more practically valuable capabilities of real-time menu analytics is time-of-day performance tracking. According to Supy’s analysis, analytics can reveal that certain items perform best at specific times of day, enabling time-based menu positioning and promotional timing.
A breakfast burrito that sells strongly in morning service but rarely in lunch service should be featured prominently on morning menus and positioned differently (or excluded) from lunch menus. A dessert that sells well in evening service but rarely in afternoon service might be removed from afternoon menus to streamline service operations without affecting meaningful revenue.
This time-based optimization extends to staffing and kitchen operations. If analytics reveal that certain complex, high-margin items sell disproportionately well on Friday evenings, scheduling additional experienced prep staff for Friday service specifically improves both execution quality and the ability to capture that revenue opportunity.
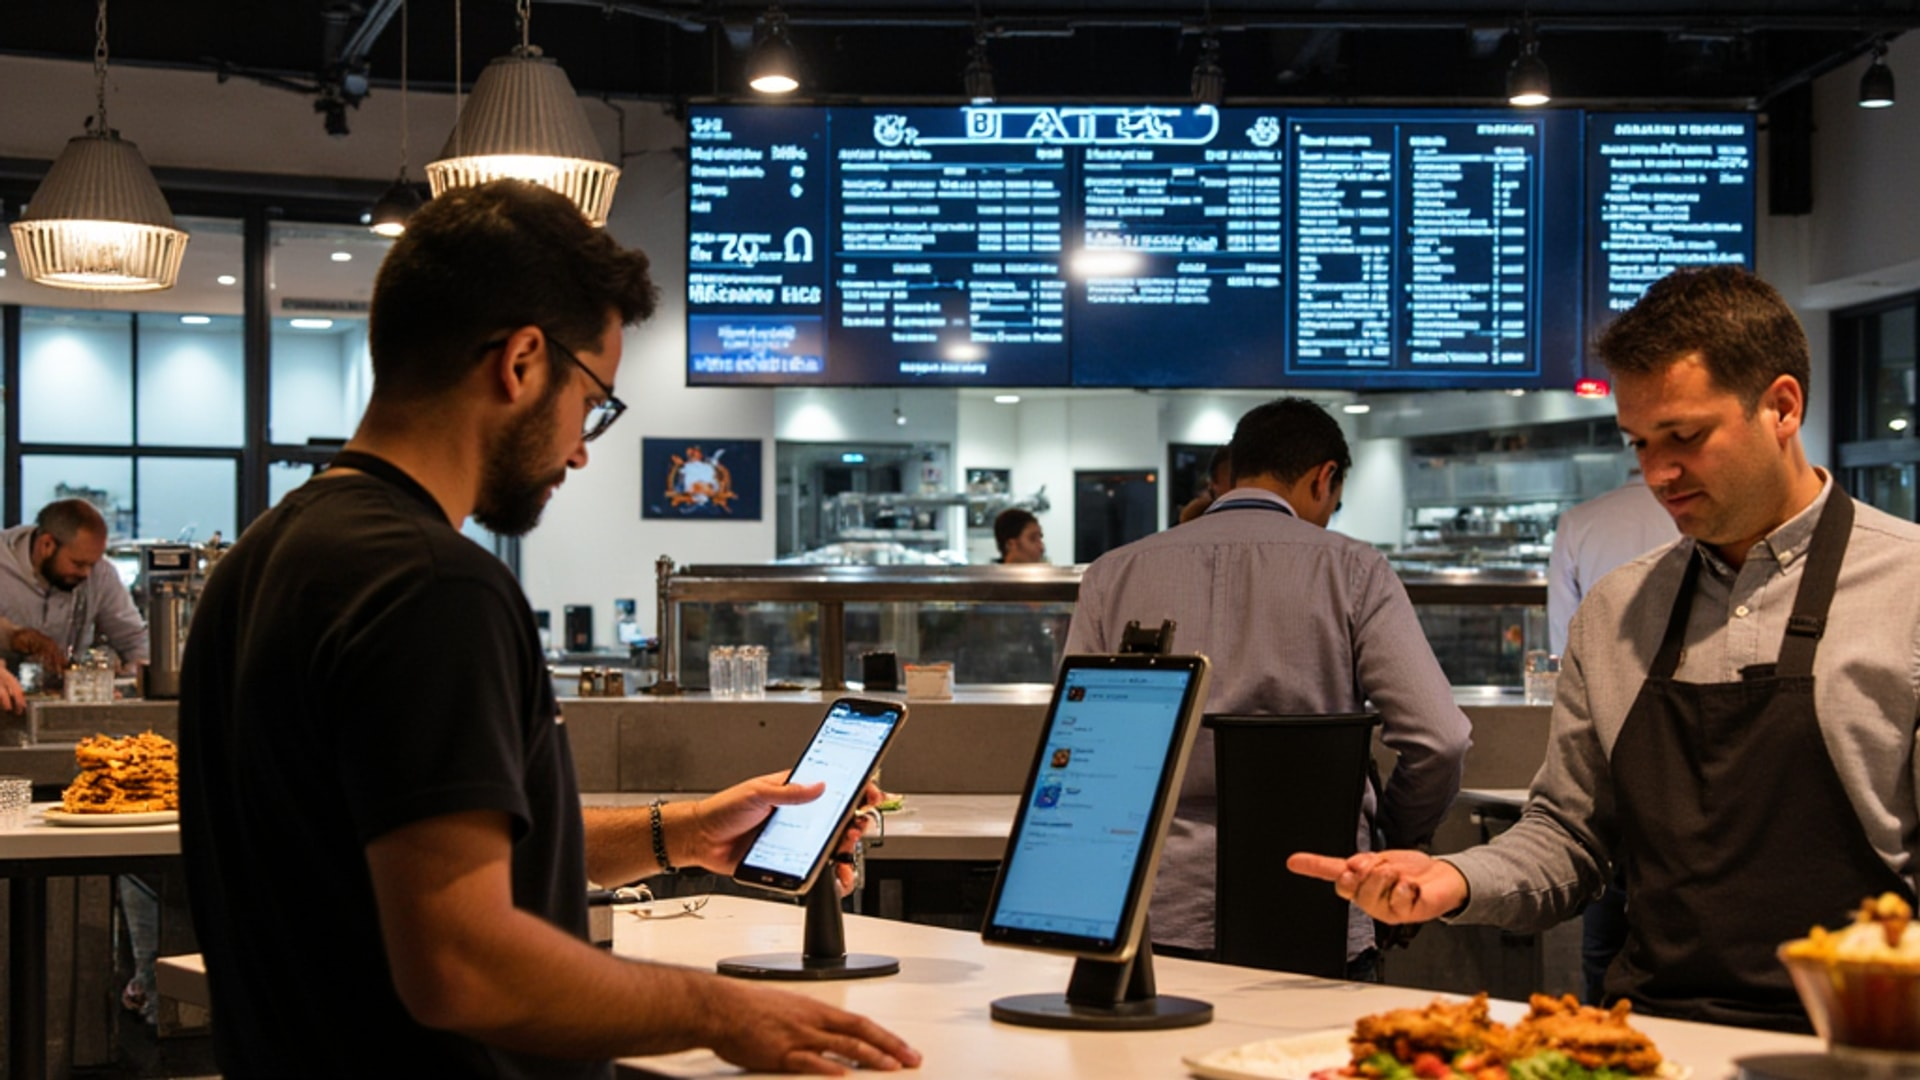
Restaurants with digital menu boards or digital menus on tablets can implement time-of-day menu variation automatically, presenting genuinely different menus at different times rather than the same menu throughout the day. The technology now makes this operationally straightforward; the decision-making about which items to feature at which times is where the analytical work lives.

Advanced Optimization Methods
Beyond the standard four-quadrant framework, more sophisticated quantitative methods are producing measurably better results.
Supy’s analysis cites data envelopment analysis as one approach that has demonstrated profitability improvements of 15% or more compared to traditional menu engineering. These advanced methods consider multiple variables simultaneously — ingredient costs, preparation time, kitchen capacity constraints, customer demand patterns, and supplier pricing — to identify optimal menu configurations that the simpler two-dimensional framework cannot surface.
The 15% profitability improvement figure is particularly striking because it comes without price increases or quality reduction. It comes from better menu configuration — having the right items in the right positions at the right price points. This is pure margin recovery from decisions that were previously made suboptimally.
For context, 15% profitability improvement on a restaurant with $1.5 million in annual revenue is $225,000 in additional profit. On a $3 million restaurant, it is $450,000. Menu engineering is one of the highest-return initiatives available to a restaurant that hasn’t done it systematically, precisely because the decisions being improved — which items to include, how to price them, how to present them — are being made constantly, every service, at every table.

Panera’s Data-Driven Menu Development
Panera provides a case study of data analytics applied not just to existing menu items but to new product development. According to Supy’s analysis, the company used menu performance analytics to identify demand for items like warm grain bowls, then introduced them after the data indicated they would succeed.
This is a different use of analytics than performance tracking of existing items. Panera’s approach involves analyzing what existing customers are ordering, identifying patterns that suggest unmet demand within the current menu structure, and developing new items to address that demand.
The result is product development that is grounded in observable customer behavior rather than culinary trend research or focus group preference claims. A customer who consistently orders a particular combination of ingredients from the existing menu is revealing preferences that can be served more directly by a new menu item specifically designed around those preferences.
This analytics-driven development approach reduces the risk of new product launches. Items developed with data backing are more likely to find their audience quickly than items developed from pure culinary intuition, because the audience has already been identified in the data before the item exists.

The Psychology Layer
Menu engineering is not purely analytical — the discipline also incorporates menu design psychology, and the interaction between data and design is where the most powerful results emerge.
Eye movement research shows that customers follow a relatively predictable pattern when they first encounter a menu. The placement of high-margin items at the natural focal points of that pattern increases their order frequency without any change in the items themselves or their prices. The analytical work identifies which items to prioritize. The design work positions them where they’ll be seen first.
Description quality is another psychological lever. Items described with sensory detail, origin story, or preparation method sell more frequently than identical items described with minimal text. A “grilled chicken sandwich” and a “free-range chicken breast, charred over hardwood and served on a toasted brioche with house-made aioli” are the same sandwich but different purchase propositions. The analytical work identifies which items need better descriptions to move from Puzzle to Star. The writing work creates the descriptions.
Visual hierarchy — the use of boxes, photos, bold text, and design elements to draw attention to specific items — is the design translation of analytical priority. Items identified as high-margin Puzzles in the analysis get visual emphasis in the design. Items identified as high-margin Stars get protection from visual clutter that might dilute their prominence.
The integration of these elements — data telling you which items matter, psychology telling you how customers process menus, design executing the strategy — is what produced the TGI Fridays results. None of these elements alone produces those outcomes. The combination does.

Implementing Menu Engineering Without a Data Science Team
The analytical framework described here does not require a data science team or enterprise analytics software. The core analysis can be conducted with POS sales data that any modern system generates automatically.
The practical starting point for an operator who has never done formal menu engineering:
Export 90 days of item-level sales data from your POS system. You need sales volume (units sold) and revenue per item.
Calculate contribution margin for each item: selling price minus food cost. If you don’t have exact food cost by item, start with your overall food cost percentage as an approximation and refine it as you develop item-level costing.
Plot items on a two-by-two grid with contribution margin on one axis and sales volume on the other. Items in the top-right quadrant are Stars. Items in the bottom-right are Plowhorses. Items in the top-left are Puzzles. Items in the bottom-left are Dogs.
Make one decision for each category: How will you feature Stars more prominently? Which Plowhorses can you cost-optimize or price-adjust? How will you reposition Puzzles visually or descriptively? Which Dogs should you remove?
Implement and measure. Track performance for 60-90 days. Quantify the sales change for repositioned items. Recalculate contribution margin for cost-optimized Plowhorses. Document what worked.
The methodology is accessible. The discipline required to do it consistently and act on what the data shows is what separates restaurants that improve their menus systematically from those that redesign them periodically based on gut feeling.
→ Read more: Menu Copywriting: Writing Descriptions That Sell
→ Read more: Contribution Margin vs. Food Cost Percentage
The menu is the most controlled customer communication channel a restaurant operates. Every customer who sits down with it receives the same document. The decisions embedded in that document — what to include, how to price it, how to present it — are among the highest-leverage decisions a restaurant operator makes. Data makes those decisions better. The TGI Fridays five-percent same-store sales increase and the 15% profitability improvements from advanced optimization methods are concrete evidence of exactly how much better they can be.