· Finance · 9 min read
Food and Labor Cost Control: Managing the Two Expenses That Make or Break Your Restaurant
Prime cost -- food plus labor -- represents 55-65% of sales and is the most controllable factor in restaurant profitability. Operators who track it weekly improve their bottom line by 2-5%. Here is how to manage both components systematically.
Prime cost is the number that most directly reflects how well you run your restaurant. It combines your two largest controllable expenses — food and beverage costs plus total labor — into a single metric that reveals operational efficiency.
According to Restaurant365, prime cost typically represents 55-65% of total sales. According to Over Easy Office, it is the metric that most directly reflects an owner’s operational decisions. Revenue can fluctuate due to external factors, and fixed costs are largely predetermined. But prime cost reflects how efficiently you convert raw materials and labor into revenue — and that is where management skill makes the most difference. Baker Tilly notes that operators who miss prime cost targets typically do so because of insufficient tracking frequency rather than structural cost problems — weekly visibility is what separates operators who catch drift early from those who discover it on a monthly P&L.
According to 7shifts, operators who track prime cost weekly routinely improve their bottom line by 2-5% compared to those who rely on monthly or quarterly reviews. On a restaurant doing $1 million in annual sales, that is $20,000-$50,000 in additional profit from better tracking alone.
Prime Cost: The Formula and Benchmarks
Prime Cost = Total COGS + Total Labor Costs
Prime Cost Percentage = Prime Cost / Total Sales
Benchmarks by Concept
| Restaurant Type | Prime Cost Target |
|---|---|
| Full-service | 60-65% |
| Quick-service | 55-60% |
| Annual sales above $850,000 | 55% or lower |
| Annual sales below $850,000 | 60% or lower |
According to Over Easy Office, going below 55% is possible but may indicate understaffing or food quality compromises. If your prime cost is under 55%, make sure that is because you are efficient, not because you are cutting corners.
Worked Example
According to Restaurant365, here is a practical calculation: For one week with COGS of $6,000 (starting inventory $12,000 + purchases $3,000 - ending inventory $9,000) plus labor of $7,000, the prime cost is $13,000. Against $22,000 in weekly sales, the prime cost percentage is 59.1% — right in the target range.
Food Cost Management
The Formula
Food Cost Percentage = (Beginning Inventory + Purchases - Ending Inventory) / Total Food Sales x 100
Benchmarks by Format
According to 7shifts, food cost benchmarks vary significantly by restaurant type:
| Format | Food Cost Target |
|---|---|
| Quick-service | 18-22% |
| Fast-casual | 28-30% |
| Full-service / upscale | 30-40% |
The ideal food cost falls between 28-35% depending on concept and location. Steakhouses run around 35% due to expensive proteins, while pasta-focused concepts can hit 28% with lower-cost ingredients.
Track Weekly, Not Monthly
According to 7shifts, weekly food cost tracking is one of the most effective financial disciplines a restaurant can implement. Weekly tracking catches problems before they compound into monthly disasters. A supplier price increase that goes unnoticed for 30 days can cost you thousands.
The weekly tracking framework involves four activities, according to 7shifts:
- Enter supplier purchases daily — record vendor names, invoice numbers, dates, and food vs. beverage breakouts
- Track hourly payroll and total sales daily
- Conduct physical inventory at the end of each tracking week
- Complete and review the prime cost report the day after the week ends
Recipe-Level Costing
According to 7shifts, recipe-level costing provides granular visibility into profitability by menu item. This goes beyond tracking your overall food cost percentage to understanding exactly how much each dish costs to produce, a foundational step in menu engineering.
Include every component in your recipe costing:
- Primary proteins and produce
- Oils and cooking fats
- Sauces and dressings
- Garnishes and accompaniments
- Side items included with the plate
According to 7shifts, this level of detail enables data-driven menu engineering, identifying which items drive margins and which should be re-priced, re-engineered, or removed.
→ Read more: Pour Cost and Beverage Control: Maximizing Bar Profitability
Seven Food Cost Control Strategies
1. Standardize Recipes
Create detailed recipe cards with precise measurements for every ingredient. When your line cook eyeballs a 6-ounce portion and actually plates 8 ounces, that is a 33% cost overrun on the protein alone. Standardized recipes ensure consistency in both quality and cost.
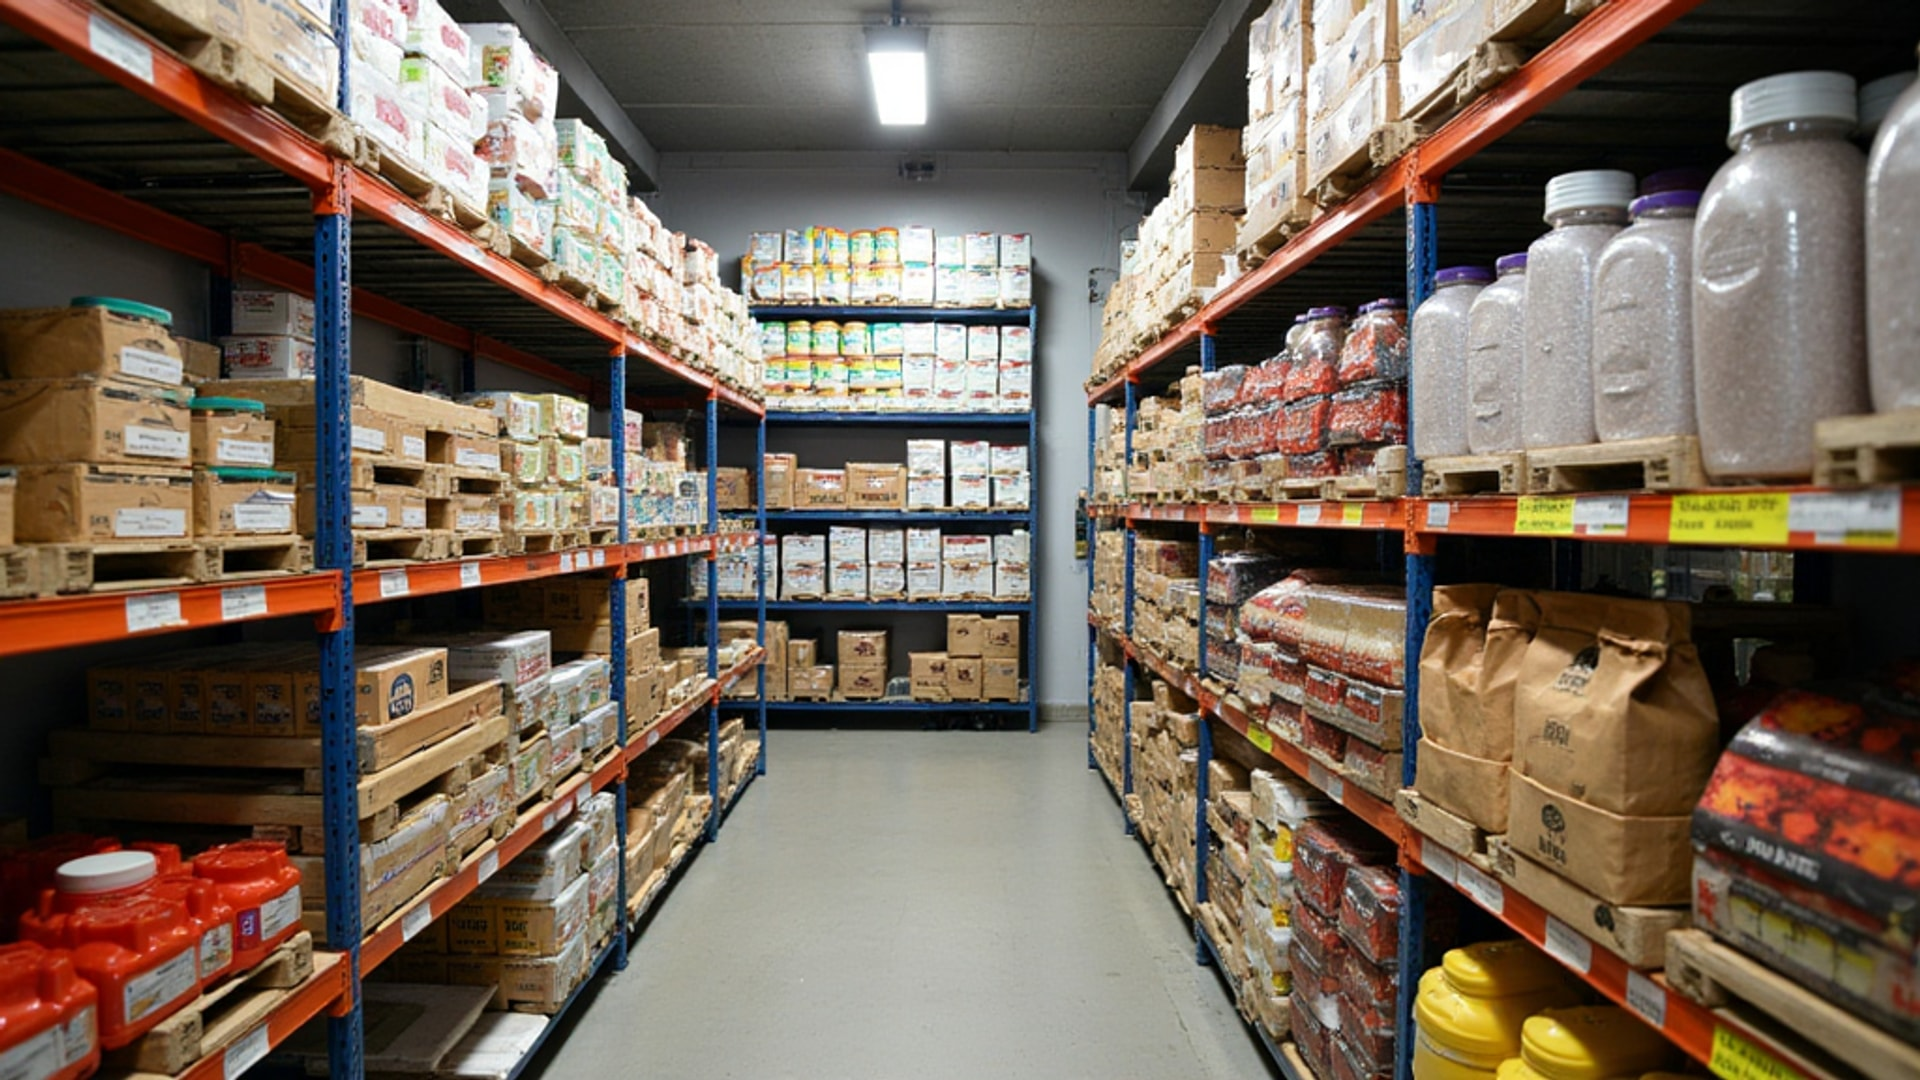
2. Maintain Tight Inventory Tracking
Use FIFO (First In, First Out) rotation to minimize spoilage. According to Lightspeed, industry data shows 4-10% of purchased food becomes pre-consumer waste. Every dollar of waste is a dollar of cost with zero revenue return.
3. Analyze Theoretical vs. Actual Food Cost
According to Restaurant365, analyzing variance between theoretical and actual food costs identifies waste, theft, or portioning issues, which ties directly into your P&L statement. Theoretical food cost is what your food cost should be based on recipes and sales mix. Actual food cost is what you measured through inventory. The gap between the two reveals the problem areas.
4. Conduct Regular Physical Inventory
Weekly counts are ideal. At minimum, count monthly. Do not rely solely on what your system says you should have — count what you actually have.
5. Invest in Waste Reduction
According to Lightspeed, restaurants save an estimated $6 for every $1 invested in waste reduction programs. That is a 500% ROI. Track waste by category (prep waste, spoilage, overproduction, plate waste) and address each source systematically.
6. Negotiate Supplier Pricing
According to Over Easy Office, negotiating supplier contracts for better pricing is a direct lever on food cost. Get quotes from multiple distributors, commit to volume where it earns discounts, and review pricing quarterly.
7. Use Menu Engineering as Cost Control
According to Lightspeed, reducing the number of menu items reduces inventory complexity and waste. Keep menus focused: 6 choices per category for quick-service, 7-10 for fine dining. Every item you remove from the menu is inventory you no longer need to buy, store, or risk wasting.
Labor Cost Management
The Formula
Labor Cost Percentage = Total Labor Costs / Total Sales x 100
According to 7shifts, labor costs include wages, overtime, payroll taxes, healthcare, vacation and sick days, and bonuses.
Benchmarks by Format
According to 7shifts, the average labor cost percentage ranges from 29-33% of sales:
| Format | Labor Cost Target |
|---|---|
| Quick-service / fast casual | Below 30% |
| Sit-down / casual dining | 30-35% |
| Fine dining | 35%+ (specialized staff) |
Ten Labor Cost Management Strategies
According to 7shifts, these ten strategies cover the full spectrum of labor cost optimization:
1. Monitor overtime closely. Overtime at 1.5x regular rate rapidly consumes budgets. A few hours of overtime per employee per week adds up to thousands per month.
2. Schedule based on sales forecasts. Use historical data by day of week, daypart, and season to predict staffing needs. Do not schedule the same number of people for Tuesday lunch as Friday dinner.
3. Implement split shifts. Where local regulations allow, split shifts let you staff lunch and dinner peaks without paying for idle afternoon hours.
4. Enforce clock-in accuracy. According to 7shifts, time rounding errors and buddy punching contribute to time theft. Enforce clock-in windows and use systems that require unique identification.
5. Expand revenue through online ordering. Online and third-party ordering adds sales without proportional labor increases, improving your labor cost percentage.
6. Analyze labor reports by time period and department. Break labor data down by daypart, day of week, season, and department (FOH vs. BOH) to find specific inefficiencies.
7. Review seasonal hiring policies. Evaluate whether every seasonal position is truly necessary. Sometimes cross-training existing staff handles seasonal volume more efficiently.
8. Boost staff retention. According to Lightspeed, employee turnover costs average $5,864 per employee in hospitality. Reducing turnover through equitable pay, benefits, and a positive work environment directly reduces your labor costs.
9. Cross-train employees. Cross-trained staff give you scheduling flexibility. When your prep cook can also run the dish pit, you need fewer total employees to cover all positions.
10. Track prime cost alongside labor metrics. Labor cost in isolation is misleading. A 35% labor cost with a 25% food cost yields a 60% prime cost — perfectly acceptable for full-service. But a 35% labor cost with a 35% food cost yields a 70% prime cost — which is unsustainable.
The Critical Warning About Cutting Labor
According to 7shifts, managers under pressure to hit labor targets often cut too deep, running short-staffed in ways that hurt customer service and actually reduce sales. The goal is optimization, not minimization.
Short-staffing creates a vicious cycle: slower service leads to lower guest satisfaction, which leads to fewer return visits, which leads to lower revenue, which makes your labor percentage look even worse. Staff to the revenue level you want to achieve, not just the revenue you currently have.
Cost Control in the Current Environment
The cost control challenge has intensified. According to Lightspeed, 95% of restaurants have experienced supply chain delays, with beef prices up 60%, fats up 50%, and eggs up 40%. These pressures make disciplined cost management more important than ever.
Beyond Food and Labor
While prime cost is the primary focus, other controllable costs also deserve attention:
Lease negotiation: According to Lightspeed, long-standing tenants with good payment records have more leverage than they realize. If your lease is coming up for renewal, negotiate.
Utility costs: LED lighting, smart thermostats, and regular HVAC maintenance reduce utility bills meaningfully. According to Lightspeed, Energy Star-certified deep fryers use 30% less energy, saving about $120 annually per unit. Multiply that across your kitchen equipment.
Theft prevention: According to NRA data cited in the topic synthesis, internal theft accounts for 75% of inventory shortages. Accountability, separation of duties, and regular audits reduce shrinkage.
Technology consolidation: According to Lightspeed, 52% of restaurateurs use POS systems to track inventory. Integrated systems that connect POS, inventory management, scheduling, and accounting reduce manual errors and provide real-time cost visibility.
→ Read more: Prime Cost Management: The One Number That Predicts Restaurant Profitability
Your Weekly Prime Cost Tracking Template
| Line Item | Week 1 | Week 2 | Week 3 | Week 4 | Monthly |
|---|---|---|---|---|---|
| Total food sales | |||||
| Total beverage sales | |||||
| Total sales | |||||
| Beginning food inventory | |||||
| Food purchases | |||||
| Ending food inventory | |||||
| Food COGS | |||||
| Food cost % | |||||
| Beverage COGS | |||||
| Total COGS | |||||
| Wages and salaries | |||||
| Payroll taxes and benefits | |||||
| Total labor | |||||
| Labor cost % | |||||
| Prime cost | |||||
| Prime cost % |
Review this every Monday morning. According to 7shifts, complete the report the day after the tracking week ends while the data is fresh.
Action Items for Immediate Impact
- Calculate your current prime cost percentage (if you do not know it, that is problem number one)
- Set up weekly food cost tracking with physical inventory counts
- Create recipe cards with precise ingredient measurements for every menu item
- Calculate theoretical food cost and compare against actual
- Review scheduling against historical sales data by daypart
- Identify your top five items by contribution margin and your bottom five
- Track overtime hours weekly and investigate any exceeding 2% of total hours
- Calculate turnover cost ($5,864 average) and compare against retention investments
- Implement FIFO rotation in all storage areas
- Get competitive quotes from at least two distributors on your top 10 ingredients
The Bottom Line
Prime cost is the single metric that best reflects how well you manage your restaurant. According to Restaurant365, it should fall between 55-65% of sales. According to 7shifts, tracking it weekly improves your bottom line by 2-5%.
The two components — food cost and labor cost — require different management approaches but the same discipline: measure weekly, compare against benchmarks, investigate variances, and take corrective action before small problems become big ones. The restaurants that survive and thrive are the ones that know their prime cost every single week and take action the moment it drifts.